
If you’ve ever worked in a Network Operations Center, you know the setup: a room full of monitors showing Grafana dashboards, alert feeds, and network maps. Engineers stare at screens, waiting for something to go red. When it does, they scramble — pulling up device consoles, checking ticket history, and calling teammates who may or may not be in the building.
Now imagine doing all of that remotely. With AI helping you triage.
The Problem With Remote NOC Work
The pandemic proved that most IT work can be done from home. But NOC work lost something in the transition. When you’re in a physical NOC, you can glance at the wall and see twelve dashboards at once. You can turn to the engineer next to you and say, “Hey, are you seeing that latency spike on the Denver POP?”
On a laptop, you’re alt-tabbing between browser tabs, pinging people on Slack, and hoping someone responds before the ticket escalates. The situational awareness disappears.
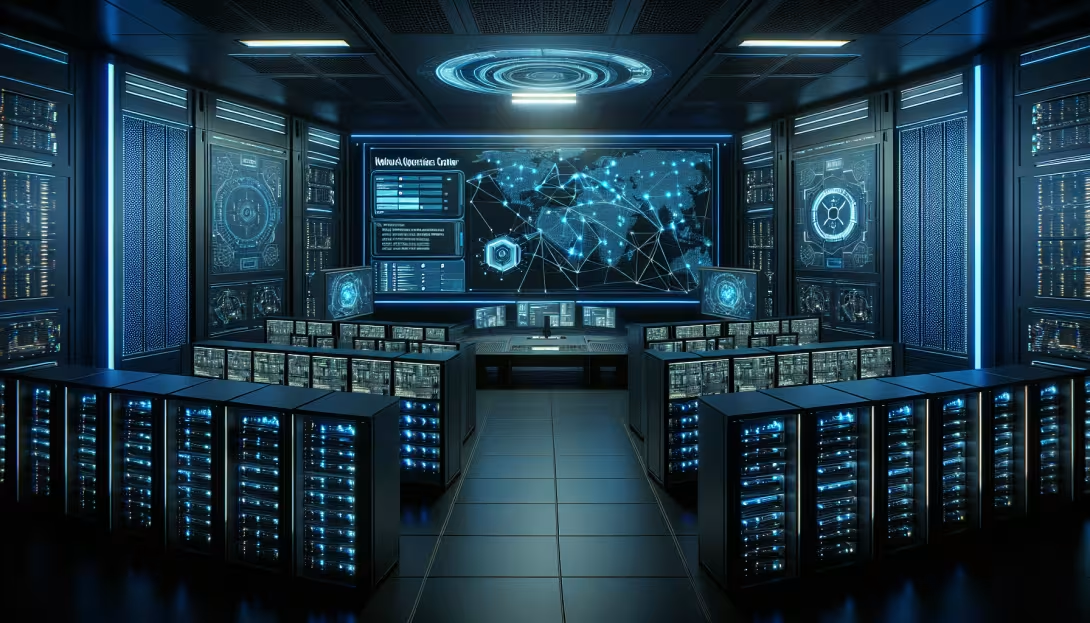
A Virtual NOC That Feels Real
Our Virtual NOC is a 3D command center where network engineers work together in a shared space — even when they’re in different cities. The room has massive display walls running live dashboards from your actual monitoring tools. Grafana, LibreNMS, PRTG, SolarWinds, Datadog — if it runs in a browser, it runs on a NOC screen.
These aren’t static images. They’re real Chromium browsers rendered onto 3D surfaces using our CEF integration. The dashboards refresh in real time. You can walk up to a screen and interact with it — zoom into a graph, click through to a device, filter by region.
Multiple engineers see the same screens simultaneously. During an outage, your whole team enters the NOC room and coordinates in real time, pointing at screens and discussing — as if you were standing in the same physical space.
AI Agents That Monitor So You Don’t Have To
Here’s where it gets interesting. We’ve built an AI bridge that connects large language models directly to the 3D environment. AI agents — represented as characters in the NOC — continuously monitor the dashboards and alert feeds.
When something goes wrong, the AI agent:
- Detects the anomaly — Correlates alerts across multiple systems (that SNMP trap from the core router happened 30 seconds after the BGP session dropped)
- Navigates to the relevant screen — Walks over to the affected dashboard and highlights the problem area
- Suggests remediation — “The BGP session to AS65001 dropped at 14:32. Last time this happened (ticket #4521), the fix was clearing the neighbor and updating the route map. Want me to pull up the device console?”
- Handles shift handoff — When a new engineer enters the NOC, the AI summarizes everything: open incidents, recent alerts, what’s been acknowledged, and what still needs attention
This isn’t replacing engineers. It’s giving them a tireless first-responder that handles the noise so they can focus on the complex problems.
Built for ISPs and MSPs
We designed the Virtual NOC with service providers in mind:
ISP Operations — Monitor your fiber network, wireless towers, and customer CPE from one virtual room. The AI detects outage patterns across your network and suggests maintenance windows before customers call in.
Managed Service Providers — Each client gets their own monitoring wall in the NOC. Your team manages ten different networks from one space without context-switching between client portals. The AI handles first-level triage: “Client ABC’s primary firewall failover triggered. Secondary is active. No customer impact. Auto-acknowledged.”
Data Centers — Walk through virtual server racks with live power, temperature, and utilization data. Browser screens show IPMI consoles, vCenter dashboards, and cloud portals. Spot a hot rack before it becomes a thermal event.
Integration With Everything
The Virtual NOC connects to your existing stack:
- Monitoring — Grafana, Zabbix, Nagios, LibreNMS, Datadog, Splunk, AWS CloudWatch. Any web-based tool works on a NOC screen.
- Alerting — PagerDuty, OpsGenie, and custom webhooks trigger in-world visual and audio events. Critical alerts make the screens flash and the alarm sound.
- Ticketing — ServiceNow, Jira, and ConnectWise tickets are viewable and manageable from within the NOC.
- Device Access — SNMP polling and direct API integration for real-time network topology overlays. Click a router on the 3D map to open its SSH console.
Why Not Just Use More Monitors?
You could buy six monitors and tile dashboards across them. Many NOC engineers do exactly that. But that only works for one person in one location. The Virtual NOC gives you:
- Shared awareness — Your whole team sees the same screens, in the same room, in real time
- AI augmentation — No amount of monitors gives you an AI agent that correlates alerts and suggests fixes
- No hardware costs — No physical NOC room, no video walls, no KVM switches
- Instant scalability — Spin up a war room in seconds during a major incident. Add screens on the fly.
The Road Ahead
The platform is built on Torque3D (open source, MIT license) with our custom browser rendering and AI bridge modules. The engine compiles, the architecture is proven, and we’re now integrating CEF for live browser rendering.
If you run a NOC — whether for an ISP, an MSP, or an enterprise — and you’re interested in seeing what AI-augmented network monitoring looks like in 3D, reach out. We’re looking for design partners who want to shape what the next generation of network operations looks like.
Comments